Sales Pipeline Analyzer
Pipeline review

Pipeline analysis composite. Pulls deal/meeting data from any CRM or tracking system, analyzes the pipeline over a user-defined period (weekly, fortnightly, monthly, quarterly), and produces both an executive summary and a detailed…
---
name: pipeline-review
version: 1.0.0
description: >
  Pipeline analysis composite. Pulls deal/meeting data from any CRM or tracking
  system, analyzes the pipeline over a user-defined period (weekly, fortnightly,
  monthly, quarterly), and produces both an executive summary and a detailed
  diagnostic report. Covers volume, qualification rates, source effectiveness,
  stage velocity, stuck deals, and actionable recommendations. Tool-agnostic —
  works with any CRM (Salesforce, HubSpot, Pipedrive, Close, Supabase, CSV).
tags: [research]
---

# Pipeline Review

Pulls deal and meeting data from whatever system the user tracks their pipeline in, analyzes it over a chosen time period, and produces a report that answers the questions a founder, sales leader, or AE actually cares about: Are we booking enough? Are they qualified? Where are deals getting stuck? What's working and what isn't?

**Two output modes:**
Overview
Pulls deal and meeting data from whatever system the user tracks their pipeline in, analyzes it over a chosen time period, and produces a report that answers the questions a founder, sales leader, or AE actually cares about: Are we booking enough? Are they qualified? Where are deals getting stuck? What's working and what isn't?
Manual install (npx, ZIP)
npx skills add gooseworks-ai/goose-skills --skill pipeline-review -g -a claude-codemkdir -p ~/.claude/skills && curl -sL https://codeload.github.com/gooseworks-ai/goose-skills/tar.gz/615c685f34f8 \
| tar -xz -C ~/.claude/skills --strip-components=4 goose-skills-615c685f34f8/skills/sales/composites/pipeline-reviewNew-Item -ItemType Directory -Force "$HOME\.claude\skills" | Out-Null; Invoke-WebRequest "https://m.agentalley.io/zip/8fc7d77b9326db23e852/pipeline-review.zip" -OutFile "$env:TEMP\pipeline-review.zip"; Expand-Archive "$env:TEMP\pipeline-review.zip" -DestinationPath "$HOME\.claude\skills" -ForceConnects with Agent Alley MCP · agentalley.io/mcp
Files included
SKILL.md27.1 KBskill.meta.json305 B
Read the files here
gooseworks-ai/
Show the full text766 lines
Pipeline Review
Pulls deal and meeting data from whatever system the user tracks their pipeline in, analyzes it over a chosen time period, and produces a report that answers the questions a founder, sales leader, or AE actually cares about: Are we booking enough? Are they qualified? Where are deals getting stuck? What's working and what isn't?
Two output modes:
- Executive summary: 1-page snapshot. Numbers, trends, red flags. What a founder reads over morning coffee.
- Detailed diagnostic: Full data tables, stage-by-stage breakdown, source analysis, stuck deal list, and specific recommendations.
Both are always produced. The executive summary sits at the top of the report.
When to Auto-Load
Load this composite when:
- User says "review my pipeline", "pipeline report", "how's our pipeline looking", "deal review"
- User says "1:1 prep", "board meeting prep", "weekly sales review"
- An upstream workflow (Pipeline Ops, daily BDR rhythm) triggers an end-of-period review
- User asks about meeting quality, conversion rates, or pipeline health
Step 0: Configuration (One-Time Setup)
On first run, collect and store these preferences. Skip on subsequent runs.
Data Source Config
| Question | Options | Stored As |
|---|---|---|
| Where do you track your pipeline? | Salesforce / HubSpot / Pipedrive / Close / Supabase / Google Sheets / CSV / Notion / Other | crm_tool |
| How do we access it? | API / Export CSV / MCP tools / Direct query | access_method |
| What object represents a "deal" in your system? | Opportunity / Deal / Lead / Meeting / Custom | deal_object |
Pipeline Stage Definitions
| Question | Purpose | Stored As |
|---|---|---|
| What are your pipeline stages in order? | Map data to a standard funnel | pipeline_stages |
| Which stage means "qualified"? | Qualification rate calculation | qualified_stage |
| Which stage means "closed won"? | Win rate calculation | won_stage |
| Which stage means "closed lost"? | Loss analysis | lost_stage |
| What is your expected sales cycle length? (days) | Identify stuck deals | expected_cycle_days |
Example stage mapping:
pipeline_stages: [
  "Lead",
  "Meeting Booked",
  "Meeting Held",
  "Qualified (Discovery Done)",
  "Proposal Sent",
  "Negotiation",
  "Closed Won",
  "Closed Lost"
]
qualified_stage: "Qualified (Discovery Done)"
won_stage: "Closed Won"
lost_stage: "Closed Lost"
expected_cycle_days: 30
Field Mapping
Different CRMs use different field names. Map the user's fields to standard analysis fields.
| Standard Field | Purpose | Stored As | Examples |
|---|---|---|---|
| Deal name | Identification | field_deal_name |
"Name", "Deal Name", "Opportunity Name" |
| Company | Account grouping | field_company |
"Company", "Account", "Organization" |
| Stage | Funnel position | field_stage |
"Stage", "Pipeline Stage", "Status" |
| Owner | Rep-level analysis | field_owner |
"Owner", "Assigned To", "Rep" |
| Source | Channel attribution | field_source |
"Lead Source", "Source", "Channel", "UTM Source" |
| Created date | Period filtering | field_created_date |
"Created Date", "Created At", "Date Added" |
| Close date | Velocity tracking | field_close_date |
"Close Date", "Expected Close", "Closed At" |
| Amount | Revenue analysis | field_amount |
"Amount", "Deal Value", "ARR", "MRR" |
| Last activity date | Stale deal detection | field_last_activity |
"Last Activity", "Last Modified", "Last Touched" |
| Meeting date | Meeting analysis | field_meeting_date |
"Meeting Date", "Call Date", "Demo Date" |
| Qualification status | Qual rate | field_qual_status |
"Qualified", "ICP Fit", "BANT Score" |
| Loss reason | Loss analysis | field_loss_reason |
"Loss Reason", "Closed Lost Reason", "Disqualification Reason" |
Not all fields are required. The analysis adapts to whatever data is available. Minimum viable: deal name + stage + created date.
Benchmarks (Optional)
| Question | Purpose | Stored As |
|---|---|---|
| What's your target meeting volume per week/month? | Compare actuals to goals | target_meetings |
| What's your target qualification rate? | Flag if below target | target_qual_rate |
| What's your target win rate? | Flag if below target | target_win_rate |
| What's your target pipeline value? | Revenue gap analysis | target_pipeline_value |
Store config in the current working directory or wherever the user prefers.
Step 1: Pull Pipeline Data
Purpose: Extract deal/meeting data from the configured CRM for the specified time period.
Input Contract
period: {
  type: "weekly" | "fortnightly" | "monthly" | "quarterly" | "custom"
  start_date: string              # ISO date (auto-calculated from type, or user-specified)
  end_date: string                # ISO date (default: today)
  comparison_period: boolean      # Include prior period for trend comparison (default: true)
}
crm_tool: string                  # From config
access_method: string             # From config
field_mapping: { ... }            # From config
Process
Based on crm_tool and access_method:
| CRM | Access Method | How to Pull |
|---|---|---|
| Salesforce | API / CSV export | SOQL query or user uploads CSV export |
| HubSpot | API / CSV export | Deals API or user uploads CSV export |
| Pipedrive | API / CSV export | Deals API or user uploads CSV export |
| Close | API / CSV export | Leads/Opportunities API or CSV |
| Supabase | Direct query | Query deals/outreach_log tables |
| Google Sheets | Sheets API / CSV | Read sheet or user exports CSV |
| Notion | Notion MCP | Query database |
| CSV | File read | User provides file path |
Pull two datasets:
- Current period: All deals created or active within the specified date range
- Comparison period: Same-length prior period (e.g., if reviewing last 2 weeks, also pull the 2 weeks before that)
Data Standardization
Regardless of source, normalize all data into a standard structure:
deals: [
  {
    id: string
    name: string
    company: string
    stage: string                   # Mapped to pipeline_stages
    owner: string | null
    source: string | null           # Lead source / channel
    created_date: string            # ISO date
    close_date: string | null       # ISO date
    last_activity_date: string | null
    meeting_date: string | null
    amount: number | null
    qualification_status: string | null
    loss_reason: string | null
    days_in_current_stage: integer  # Calculated
    total_age_days: integer         # Calculated from created_date
  }
]
Output Contract
pipeline_data: {
  current_period: {
    start_date: string
    end_date: string
    deals: [...]                    # Standardized deal records
    deal_count: integer
  }
  comparison_period: {
    start_date: string
    end_date: string
    deals: [...]
    deal_count: integer
  } | null
}
Human Checkpoint
## Data Pulled

Source: [CRM name]
Current period: [start] to [end] — X deals
Comparison period: [start] to [end] — Y deals
Fields available: [list of mapped fields]
Fields missing: [any unmapped fields — analysis will adapt]

Data looks correct? (Y/n)
Step 2: Analyze Pipeline
Purpose: Run the full analysis across seven dimensions. Pure computation + LLM reasoning — inherently tool-agnostic.
Input Contract
pipeline_data: { ... }               # From Step 1
pipeline_stages: string[]            # From config
qualified_stage: string              # From config
won_stage: string                    # From config
lost_stage: string                   # From config
expected_cycle_days: integer         # From config
benchmarks: { ... } | null           # From config (optional)
Analysis Dimensions
Run all seven analyses on the current period data. Where comparison period exists, calculate period-over-period trends.
Analysis 1: Volume Metrics
Questions answered: How many meetings/deals did we book? Is the volume going up or down?
| Metric | How to Calculate |
|---|---|
| Total deals created | Count deals with created_date in period |
| Meetings booked | Count deals that reached "Meeting Booked" stage or have a meeting_date |
| Meetings held | Count deals at or past "Meeting Held" stage |
| No-show rate | (Meetings booked - Meetings held) / Meetings booked |
| Period-over-period change | Compare to comparison period |
| vs. Target | Compare to target_meetings if set |
| Weekly run rate | Total / weeks in period |
Output:
volume: {
  deals_created: integer
  meetings_booked: integer
  meetings_held: integer
  no_show_count: integer
  no_show_rate: percentage
  weekly_run_rate: float
  vs_prior_period: {
    deals_change: percentage          # "+15%" or "-8%"
    meetings_change: percentage
  } | null
  vs_target: {
    target: integer
    actual: integer
    gap: integer                      # Positive = ahead, negative = behind
  } | null
}
Analysis 2: Qualification Breakdown
Questions answered: How many meetings were qualified? Unqualified? What's our qualification rate?
| Metric | How to Calculate |
|---|---|
| Qualified deals | Deals at or past qualified_stage |
| Unqualified deals | Deals that were closed lost before reaching qualified_stage, or deals marked as unqualified |
| Qualification rate | Qualified / (Qualified + Unqualified) |
| Pending qualification | Deals still between "Meeting Held" and qualified_stage |
| Disqualification reasons | Group loss_reason for deals lost pre-qualification |
| vs. Prior period | Compare qualification rate |
| vs. Target | Compare to target_qual_rate if set |
Output:
qualification: {
  qualified_count: integer
  unqualified_count: integer
  pending_count: integer
  qualification_rate: percentage
  vs_prior_period: percentage_change | null
  vs_target: { target: percentage, actual: percentage } | null
  top_disqualification_reasons: [
    { reason: string, count: integer, percentage: percentage }
  ]
}
Analysis 3: Source / Channel Attribution
Questions answered: Where are leads coming from? Which sources produce the most qualified meetings?
| Metric | How to Calculate |
|---|---|
| Deals by source | Group by source, count |
| Meetings by source | Group by source, count meetings |
| Qualification rate by source | For each source: qualified / total |
| Best source (volume) | Source with most deals |
| Best source (quality) | Source with highest qualification rate (min 5 deals for statistical relevance) |
| Source with highest conversion to won | Source with best close rate |
| Source trends | Compare to prior period |
Output:
source_attribution: {
  by_source: [
    {
      source: string
      deals_created: integer
      meetings_booked: integer
      meetings_qualified: integer
      qualification_rate: percentage
      deals_won: integer
      win_rate: percentage
      revenue: number | null
      vs_prior_period: percentage_change | null
    }
  ]
  best_volume_source: string
  best_quality_source: string
  best_conversion_source: string
  source_concentration_warning: string | null   # Flag if >60% from one source
}
Analysis 4: Stage Distribution & Velocity
Questions answered: Where are deals sitting in the pipeline? How fast are they moving through stages?
| Metric | How to Calculate |
|---|---|
| Deal count by stage | Group active deals by current stage |
| Revenue by stage | Sum amount per stage |
| Average days in each stage | For deals that passed through each stage, average days_in_current_stage |
| Stage-to-stage conversion | What % of deals move from one stage to the next |
| Pipeline velocity | (Deals × Win Rate × Avg Deal Size) / Avg Cycle Length |
| Total pipeline value | Sum of amount for all active deals |
| Weighted pipeline | Sum of (amount × stage probability) for each deal |
Stage probability defaults (override with actual data if available):
Lead: 5%
Meeting Booked: 10%
Meeting Held: 20%
Qualified: 40%
Proposal Sent: 60%
Negotiation: 80%
Closed Won: 100%
Closed Lost: 0%
Output:
stage_analysis: {
  by_stage: [
    {
      stage: string
      deal_count: integer
      revenue: number | null
      weighted_revenue: number | null
      avg_days_in_stage: float
      conversion_to_next_stage: percentage
    }
  ]
  total_pipeline_value: number | null
  weighted_pipeline_value: number | null
  pipeline_velocity: number | null
  avg_cycle_length_days: float
  vs_expected_cycle: string          # "On pace", "X days slower than expected", etc.
}
Analysis 5: Stuck Deals & At-Risk Pipeline
Questions answered: Are there deals that have been sitting too long? What's at risk of going stale?
| Metric | How to Calculate |
|---|---|
| Stuck deals | Deals where days_in_current_stage > 2× average for that stage, OR > expected_cycle_days total |
| No activity deals | Deals where last_activity_date > 14 days ago |
| Aging deals | Deals where total_age_days > 1.5× expected_cycle_days |
| At-risk revenue | Sum of amount for stuck + no activity + aging deals |
| Concentration risk | Any single deal > 30% of total pipeline value |
Stuck deal threshold: A deal is "stuck" if it's been in its current stage for more than 2× the average time deals spend in that stage. If we don't have enough data for stage averages, use these defaults:
| Stage | Expected Max Days |
|---|---|
| Lead | 3 days |
| Meeting Booked | 7 days |
| Meeting Held | 5 days |
| Qualified | 10 days |
| Proposal Sent | 14 days |
| Negotiation | 14 days |
Output:
stuck_and_at_risk: {
  stuck_deals: [
    {
      name: string
      company: string
      stage: string
      days_in_stage: integer
      expected_max_days: integer
      owner: string | null
      amount: number | null
      last_activity: string | null
      recommended_action: string      # "Follow up", "Ask for timeline", "Qualify out"
    }
  ]
  no_activity_deals: [
    {
      name: string
      company: string
      stage: string
      days_since_activity: integer
      owner: string | null
      recommended_action: string
    }
  ]
  at_risk_revenue: number | null
  concentration_risks: [
    { deal_name: string, amount: number, percentage_of_pipeline: percentage }
  ] | null
}
Analysis 6: Win/Loss Analysis
Questions answered: What's our win rate? Why are we losing deals?
| Metric | How to Calculate |
|---|---|
| Win rate | Won / (Won + Lost) for deals closed in period |
| Win rate by source | Group by source |
| Win rate by owner | Group by rep |
| Average deal size (won) | Avg amount of won deals |
| Average time to close | Avg days from created to closed won |
| Top loss reasons | Group loss_reason, count |
| Loss stage distribution | At which stage are deals most often lost? |
| vs. Prior period | Compare win rate |
| vs. Target | Compare to target_win_rate if set |
Output:
win_loss: {
  deals_won: integer
  deals_lost: integer
  win_rate: percentage
  vs_prior_period: percentage_change | null
  vs_target: { target: percentage, actual: percentage } | null
  avg_deal_size_won: number | null
  avg_days_to_close: float
  win_rate_by_source: [ { source: string, win_rate: percentage, count: integer } ]
  win_rate_by_owner: [ { owner: string, win_rate: percentage, count: integer } ] | null
  top_loss_reasons: [
    { reason: string, count: integer, percentage: percentage }
  ]
  loss_by_stage: [
    { stage: string, lost_count: integer, percentage: percentage }
  ]
}
Analysis 7: Forecast & Coverage
Questions answered: Are we going to hit our number? Do we have enough pipeline to cover the target?
Only run this analysis if target_pipeline_value or revenue targets are configured.
| Metric | How to Calculate |
|---|---|
| Pipeline coverage ratio | Weighted pipeline / remaining quota |
| Commit forecast | Sum of deals in Negotiation + Proposal stage |
| Best case forecast | Commit + Qualified deals × historical win rate |
| Gap to target | Target - best case forecast |
| Required deals to close gap | Gap / average deal size |
| Required meetings to close gap | Required deals / historical meeting-to-close rate |
Output:
forecast: {
  target: number
  commit_forecast: number
  best_case_forecast: number
  gap_to_target: number
  pipeline_coverage_ratio: float     # 3x+ is healthy, <2x is risky
  deals_needed_to_close_gap: integer
  meetings_needed_to_close_gap: integer
  coverage_assessment: "Healthy (3x+)" | "Adequate (2-3x)" | "At risk (<2x)" | "Critical (<1x)"
} | null
Output Contract (Full Analysis)
analysis: {
  period: { type, start_date, end_date }
  volume: { ... }
  qualification: { ... }
  source_attribution: { ... }
  stage_analysis: { ... }
  stuck_and_at_risk: { ... }
  win_loss: { ... }
  forecast: { ... } | null
}
No human checkpoint after this step — the analysis feeds directly into report generation.
Step 3: Generate Report
Purpose: Transform the raw analysis into two report formats: an executive summary and a detailed diagnostic. Pure LLM reasoning.
Input Contract
analysis: { ... }                     # From Step 2
benchmarks: { ... } | null            # From config
Executive Summary Format
One page. Numbers and trends. What a founder or sales leader needs to see in 60 seconds.
# Pipeline Review — [Period Type]: [Start Date] to [End Date]

## Snapshot
| Metric | This Period | Prior Period | Change |
|--------|------------|-------------|--------|
| Meetings booked | X | Y | +/-Z% |
| Meetings held | X | Y | +/-Z% |
| Qualification rate | X% | Y% | +/-Z pts |
| Win rate | X% | Y% | +/-Z pts |
| Pipeline value | $X | $Y | +/-Z% |
| Avg deal size | $X | $Y | +/-Z% |
| Avg days to close | X | Y | +/-Z |

## Red Flags
- [Any metric trending down significantly]
- [Stuck deals above threshold]
- [Pipeline coverage below 2x]
- [Single source >60% of pipeline]
- [No-show rate above 20%]

## Green Lights
- [Metrics trending up]
- [Sources performing well]
- [Stages moving faster than expected]

## Top 3 Actions
1. [Most impactful thing to do this week]
2. [Second most impactful]
3. [Third most impactful]
Detailed Diagnostic Format
Full data tables, charts (as markdown tables), and commentary.
# Pipeline Diagnostic — [Period]

## 1. Volume
[Volume metrics table]
[Commentary: is volume on track? Trending up or down? Meeting goals?]

## 2. Qualification
[Qualification breakdown table]
[Disqualification reasons table]
[Commentary: are we meeting with the right people? Common DQ reasons to address?]

## 3. Source Effectiveness
[Source attribution table — sorted by qualification rate]
[Commentary: which channels are working? Which are wasting time?
 Where should we invest more? Where should we cut?]

## 4. Stage Distribution & Velocity
[Stage breakdown table with counts, revenue, avg days, conversion rates]
[Commentary: where is the pipeline fat? Where is it thin?
 Is velocity healthy or slowing?]

## 5. Stuck Deals
[Stuck deals table with recommended actions]
[No-activity deals table]
[Commentary: total at-risk revenue, common patterns in stuck deals]

## 6. Win/Loss Analysis
[Win rate table — overall, by source, by owner]
[Loss reasons table]
[Loss by stage table]
[Commentary: why are we losing? At which stage? Any patterns?]

## 7. Forecast & Coverage (if targets set)
[Forecast table]
[Coverage assessment]
[Commentary: will we hit the number? What needs to happen?]

## Recommendations
[Numbered list of specific, actionable recommendations based on the data.
 Each recommendation should cite the specific data point that drives it.]
Recommendations Logic
Generate recommendations based on patterns found in the analysis:
| Pattern | Recommendation |
|---|---|
| Qualification rate <40% | "Review ICP targeting — we're meeting with too many unqualified prospects. Top DQ reason is [X]. Consider tightening [source/criteria]." |
| No-show rate >20% | "Implement meeting confirmation flow — send reminders 24h and 1h before. Current no-show rate of X% is costing Y meetings/period." |
| One source >60% of pipeline | "Diversify lead sources — [source] drives X% of pipeline. If this channel underperforms, pipeline collapses. Test [alternative channels]." |
| High-quality source with low volume | "Scale [source] — it has a X% qualification rate (best in pipeline) but only Y% of volume. Invest more here." |
| Deals stuck in a specific stage | "Unblock [stage] — X deals averaging Y days (2× normal). Common pattern: [observation]. Recommended: [specific action]." |
| Win rate declining | "Win rate dropped from X% to Y%. Top loss reason shifted to [Z]. Consider: [specific response]." |
| Pipeline coverage <2x | "Pipeline coverage is [X]x against [target]. Need Z more qualified deals to close the gap. At current conversion rates, that requires W meetings." |
| Average cycle lengthening | "Deals are taking X days longer to close vs. prior period. Bottleneck is at [stage]. Consider: [specific action to accelerate]." |
| High loss rate at specific stage | "X% of losses happen at [stage]. This suggests [interpretation]. Consider: [action]." |
Output Contract
report: {
  executive_summary: string           # Markdown formatted
  detailed_diagnostic: string         # Markdown formatted
  recommendations: [
    {
      priority: "high" | "medium" | "low"
      area: string                    # "volume", "qualification", "source", "velocity", "stuck", "win_loss", "forecast"
      recommendation: string
      data_point: string              # The specific metric that drove this recommendation
      expected_impact: string         # What fixing this would do
    }
  ]
  stuck_deal_actions: [
    {
      deal_name: string
      company: string
      action: string
      owner: string | null
    }
  ]
}
Human Checkpoint
Present the executive summary first, then offer the detailed diagnostic:
[Executive Summary rendered]

---

Full detailed diagnostic is also available.

Actions from this review:
1. [High priority recommendation]
2. [High priority recommendation]
3. [Medium priority recommendation]

Stuck deals requiring immediate attention:
| Deal | Company | Stage | Days Stuck | Action |
|------|---------|-------|------------|--------|
| ... | ... | ... | ... | ... |

Want to see the full diagnostic? Or take action on any of these recommendations?
Step 4: Export & Share (Optional)
Purpose: Save the report and optionally push it to the user's preferred location.
Process
Based on user preference:
| Destination | How |
|---|---|
| Markdown file | Save to the current working directory |
| Google Sheets | Export data tables to a sheet (metrics, deal list, source breakdown) |
| Notion | Push to a Notion database page via Notion MCP |
| Slack | Send executive summary to a channel |
| Send via AgentMail API (agentmail.dev) or other email API | |
| stdout | Just display it (default) |
Execution Summary
| Step | Tool Dependency | Human Checkpoint | Typical Time |
|---|---|---|---|
| 0. Config | None | First run only | 5 min (once) |
| 1. Pull Data | Configurable (CRM API, CSV, Supabase, etc.) | Verify data looks correct | 1-2 min |
| 2. Analyze | None (computation + LLM reasoning) | None — feeds directly to report | Automatic |
| 3. Generate Report | None (LLM reasoning) | Review executive summary, drill into details | 5-10 min |
| 4. Export | Configurable (file, Sheets, Notion, etc.) | Optional | 1 min |
Total human review time: ~10-15 minutes for a full pipeline review that would normally take 30-60 minutes of manual CRM digging.
Adapting to Data Availability
Not every CRM has every field. The analysis degrades gracefully:
| Missing Field | What Gets Skipped | Analysis Still Works? |
|---|---|---|
amount |
Revenue metrics, weighted pipeline, forecast | Yes — volume and stage analysis still run |
source |
Source attribution (Analysis 3) | Yes — everything else still runs |
loss_reason |
Loss reason breakdown | Yes — win/loss rate still calculates |
owner |
Per-rep analysis | Yes — aggregate metrics still run |
last_activity_date |
No-activity deal detection | Partially — stuck deals still detected via stage duration |
close_date |
Velocity, avg days to close | Partially — stage distribution still works |
| Comparison period data | Period-over-period trends | Yes — single period analysis still produces full report |
Minimum viable data for a useful report: Deal name + Stage + Created date. Everything else enriches but isn't required.
Cadence Guide
| Review Type | Period | Audience | Focus |
|---|---|---|---|
| Weekly standup | Last 7 days | Sales team | Volume, stuck deals, this week's priorities |
| Fortnightly review | Last 14 days | Sales leader | Qualification, source effectiveness, trends |
| Monthly review | Last 30 days | Founder / VP Sales | Full diagnostic, win/loss, forecast |
| Quarterly business review | Last 90 days | Leadership / Board | Trends, unit economics, strategic recommendations |
The report depth automatically scales with the period length. A weekly review emphasizes volume and stuck deals. A quarterly review emphasizes trends, conversion rates, and strategic patterns.
Tips
- Run this at a consistent cadence. The value compounds — trends only become visible when you have multiple data points. A monthly review is 10x more useful when you can compare to the last 3 months.
- Don't skip the stuck deals section. This is where the immediate ROI lives. Every stuck deal surfaced and unblocked is revenue accelerated.
- Source attribution is the highest-leverage insight. Knowing that LinkedIn generates 3x the qualification rate of cold email means you should shift budget and effort. Most teams never run this analysis.
- Watch for vanity metrics. "We booked 40 meetings" means nothing if qualification rate is 15%. Volume without quality is a waste of everyone's time.
- The no-show rate is a hidden leak. Most teams track meetings booked but not meetings held. A 25% no-show rate means 1 in 4 meetings is wasted effort. Fix with confirmation sequences.
- Pipeline coverage below 2x is a red flag. If you need $100K this quarter and your weighted pipeline is $150K, you probably won't make it. Healthy is 3x+.
- Loss reason data is only useful if reps actually fill it in. If 80% of losses say "Other" or are blank, the loss analysis is meaningless. Fix data hygiene first.
| 1 | |
| 2 | name pipeline-review |
| 3 | version 1.0.0 |
| 4 | description > |
| 5 | Pipeline analysis composite. Pulls deal/meeting data from any CRM or tracking |
| 6 | system, analyzes the pipeline over a user-defined period (weekly, fortnightly, |
| 7 | monthly, quarterly), and produces both an executive summary and a detailed |
| 8 | diagnostic report. Covers volume, qualification rates, source effectiveness, |
| 9 | stage velocity, stuck deals, and actionable recommendations. Tool-agnostic — |
| 10 | works with any CRM (Salesforce, HubSpot, Pipedrive, Close, Supabase, CSV). |
| 11 | tags [research] |
| 12 | |
| 13 | |
| 14 | # Pipeline Review |
| 15 | |
| 16 | Pulls deal and meeting data from whatever system the user tracks their pipeline in, analyzes it over a chosen time period, and produces a report that answers the questions a founder, sales leader, or AE actually cares about: Are we booking enough? Are they qualified? Where are deals getting stuck? What's working and what isn't? |
| 17 | |
| 18 | **Two output modes:** |
| 19 | **Executive summary:** 1-page snapshot. Numbers, trends, red flags. What a founder reads over morning coffee. |
| 20 | **Detailed diagnostic:** Full data tables, stage-by-stage breakdown, source analysis, stuck deal list, and specific recommendations. |
| 21 | |
| 22 | Both are always produced. The executive summary sits at the top of the report. |
| 23 | |
| 24 | ## When to Auto-Load |
| 25 | |
| 26 | Load this composite when: |
| 27 | User says "review my pipeline", "pipeline report", "how's our pipeline looking", "deal review" |
| 28 | User says "1:1 prep", "board meeting prep", "weekly sales review" |
| 29 | An upstream workflow (Pipeline Ops, daily BDR rhythm) triggers an end-of-period review |
| 30 | User asks about meeting quality, conversion rates, or pipeline health |
| 31 | |
| 32 | |
| 33 | |
| 34 | ## Step 0: Configuration (One-Time Setup) |
| 35 | |
| 36 | On first run, collect and store these preferences. Skip on subsequent runs. |
| 37 | |
| 38 | ### Data Source Config |
| 39 | |
| 40 | | Question | Options | Stored As | |
| 41 | |----------|---------|-----------| |
| 42 | | Where do you track your pipeline? | Salesforce / HubSpot / Pipedrive / Close / Supabase / Google Sheets / CSV / Notion / Other | `crm_tool` | |
| 43 | | How do we access it? | API / Export CSV / MCP tools / Direct query | `access_method` | |
| 44 | | What object represents a "deal" in your system? | Opportunity / Deal / Lead / Meeting / Custom | `deal_object` | |
| 45 | |
| 46 | ### Pipeline Stage Definitions |
| 47 | |
| 48 | | Question | Purpose | Stored As | |
| 49 | |----------|---------|-----------| |
| 50 | | What are your pipeline stages in order? | Map data to a standard funnel | `pipeline_stages` | |
| 51 | | Which stage means "qualified"? | Qualification rate calculation | `qualified_stage` | |
| 52 | | Which stage means "closed won"? | Win rate calculation | `won_stage` | |
| 53 | | Which stage means "closed lost"? | Loss analysis | `lost_stage` | |
| 54 | | What is your expected sales cycle length? (days) | Identify stuck deals | `expected_cycle_days` | |
| 55 | |
| 56 | **Example stage mapping:** |
| 57 | |
| 58 | pipeline_stages: [ |
| 59 | "Lead", |
| 60 | "Meeting Booked", |
| 61 | "Meeting Held", |
| 62 | "Qualified (Discovery Done)", |
| 63 | "Proposal Sent", |
| 64 | "Negotiation", |
| 65 | "Closed Won", |
| 66 | "Closed Lost" |
| 67 | ] |
| 68 | qualified_stage: "Qualified (Discovery Done)" |
| 69 | won_stage: "Closed Won" |
| 70 | lost_stage: "Closed Lost" |
| 71 | expected_cycle_days: 30 |
| 72 | |
| 73 | |
| 74 | ### Field Mapping |
| 75 | |
| 76 | Different CRMs use different field names. Map the user's fields to standard analysis fields. |
| 77 | |
| 78 | | Standard Field | Purpose | Stored As | Examples | |
| 79 | |---------------|---------|-----------|---------| |
| 80 | | Deal name | Identification | `field_deal_name` | "Name", "Deal Name", "Opportunity Name" | |
| 81 | | Company | Account grouping | `field_company` | "Company", "Account", "Organization" | |
| 82 | | Stage | Funnel position | `field_stage` | "Stage", "Pipeline Stage", "Status" | |
| 83 | | Owner | Rep-level analysis | `field_owner` | "Owner", "Assigned To", "Rep" | |
| 84 | | Source | Channel attribution | `field_source` | "Lead Source", "Source", "Channel", "UTM Source" | |
| 85 | | Created date | Period filtering | `field_created_date` | "Created Date", "Created At", "Date Added" | |
| 86 | | Close date | Velocity tracking | `field_close_date` | "Close Date", "Expected Close", "Closed At" | |
| 87 | | Amount | Revenue analysis | `field_amount` | "Amount", "Deal Value", "ARR", "MRR" | |
| 88 | | Last activity date | Stale deal detection | `field_last_activity` | "Last Activity", "Last Modified", "Last Touched" | |
| 89 | | Meeting date | Meeting analysis | `field_meeting_date` | "Meeting Date", "Call Date", "Demo Date" | |
| 90 | | Qualification status | Qual rate | `field_qual_status` | "Qualified", "ICP Fit", "BANT Score" | |
| 91 | | Loss reason | Loss analysis | `field_loss_reason` | "Loss Reason", "Closed Lost Reason", "Disqualification Reason" | |
| 92 | |
| 93 | **Not all fields are required.** The analysis adapts to whatever data is available. Minimum viable: deal name + stage + created date. |
| 94 | |
| 95 | ### Benchmarks (Optional) |
| 96 | |
| 97 | | Question | Purpose | Stored As | |
| 98 | |----------|---------|-----------| |
| 99 | | What's your target meeting volume per week/month? | Compare actuals to goals | `target_meetings` | |
| 100 | | What's your target qualification rate? | Flag if below target | `target_qual_rate` | |
| 101 | | What's your target win rate? | Flag if below target | `target_win_rate` | |
| 102 | | What's your target pipeline value? | Revenue gap analysis | `target_pipeline_value` | |
| 103 | |
| 104 | **Store config** in the current working directory or wherever the user prefers. |
| 105 | |
| 106 | |
| 107 | |
| 108 | ## Step 1: Pull Pipeline Data |
| 109 | |
| 110 | **Purpose:** Extract deal/meeting data from the configured CRM for the specified time period. |
| 111 | |
| 112 | ### Input Contract |
| 113 | |
| 114 | |
| 115 | period: { |
| 116 | type: "weekly" | "fortnightly" | "monthly" | "quarterly" | "custom" |
| 117 | start_date: string # ISO date (auto-calculated from type, or user-specified) |
| 118 | end_date: string # ISO date (default: today) |
| 119 | comparison_period: boolean # Include prior period for trend comparison (default: true) |
| 120 | } |
| 121 | crm_tool: string # From config |
| 122 | access_method: string # From config |
| 123 | field_mapping: { ... } # From config |
| 124 | |
| 125 | |
| 126 | ### Process |
| 127 | |
| 128 | Based on `crm_tool` and `access_method`: |
| 129 | |
| 130 | | CRM | Access Method | How to Pull | |
| 131 | |-----|--------------|-------------| |
| 132 | | **Salesforce** | API / CSV export | SOQL query or user uploads CSV export | |
| 133 | | **HubSpot** | API / CSV export | Deals API or user uploads CSV export | |
| 134 | | **Pipedrive** | API / CSV export | Deals API or user uploads CSV export | |
| 135 | | **Close** | API / CSV export | Leads/Opportunities API or CSV | |
| 136 | | **Supabase** | Direct query | Query deals/outreach_log tables | |
| 137 | | **Google Sheets** | Sheets API / CSV | Read sheet or user exports CSV | |
| 138 | | **Notion** | Notion MCP | Query database | |
| 139 | | **CSV** | File read | User provides file path | |
| 140 | |
| 141 | **Pull two datasets:** |
| 142 | **Current period:** All deals created or active within the specified date range |
| 143 | **Comparison period:** Same-length prior period (e.g., if reviewing last 2 weeks, also pull the 2 weeks before that) |
| 144 | |
| 145 | ### Data Standardization |
| 146 | |
| 147 | Regardless of source, normalize all data into a standard structure: |
| 148 | |
| 149 | |
| 150 | deals: [ |
| 151 | { |
| 152 | id: string |
| 153 | name: string |
| 154 | company: string |
| 155 | stage: string # Mapped to pipeline_stages |
| 156 | owner: string | null |
| 157 | source: string | null # Lead source / channel |
| 158 | created_date: string # ISO date |
| 159 | close_date: string | null # ISO date |
| 160 | last_activity_date: string | null |
| 161 | meeting_date: string | null |
| 162 | amount: number | null |
| 163 | qualification_status: string | null |
| 164 | loss_reason: string | null |
| 165 | days_in_current_stage: integer # Calculated |
| 166 | total_age_days: integer # Calculated from created_date |
| 167 | } |
| 168 | ] |
| 169 | |
| 170 | |
| 171 | ### Output Contract |
| 172 | |
| 173 | |
| 174 | pipeline_data: { |
| 175 | current_period: { |
| 176 | start_date: string |
| 177 | end_date: string |
| 178 | deals: [...] # Standardized deal records |
| 179 | deal_count: integer |
| 180 | } |
| 181 | comparison_period: { |
| 182 | start_date: string |
| 183 | end_date: string |
| 184 | deals: [...] |
| 185 | deal_count: integer |
| 186 | } | null |
| 187 | } |
| 188 | |
| 189 | |
| 190 | ### Human Checkpoint |
| 191 | |
| 192 | |
| 193 | ## Data Pulled |
| 194 | |
| 195 | Source: [CRM name] |
| 196 | Current period: [start] to [end] — X deals |
| 197 | Comparison period: [start] to [end] — Y deals |
| 198 | Fields available: [list of mapped fields] |
| 199 | Fields missing: [any unmapped fields — analysis will adapt] |
| 200 | |
| 201 | Data looks correct? (Y/n) |
| 202 | |
| 203 | |
| 204 | |
| 205 | |
| 206 | ## Step 2: Analyze Pipeline |
| 207 | |
| 208 | **Purpose:** Run the full analysis across seven dimensions. Pure computation + LLM reasoning — inherently tool-agnostic. |
| 209 | |
| 210 | ### Input Contract |
| 211 | |
| 212 | |
| 213 | pipeline_data: { ... } # From Step 1 |
| 214 | pipeline_stages: string[] # From config |
| 215 | qualified_stage: string # From config |
| 216 | won_stage: string # From config |
| 217 | lost_stage: string # From config |
| 218 | expected_cycle_days: integer # From config |
| 219 | benchmarks: { ... } | null # From config (optional) |
| 220 | |
| 221 | |
| 222 | ### Analysis Dimensions |
| 223 | |
| 224 | Run all seven analyses on the current period data. Where comparison period exists, calculate period-over-period trends. |
| 225 | |
| 226 | |
| 227 | |
| 228 | #### Analysis 1: Volume Metrics |
| 229 | |
| 230 | **Questions answered:** How many meetings/deals did we book? Is the volume going up or down? |
| 231 | |
| 232 | | Metric | How to Calculate | |
| 233 | |--------|-----------------| |
| 234 | | Total deals created | Count deals with `created_date` in period | |
| 235 | | Meetings booked | Count deals that reached "Meeting Booked" stage or have a `meeting_date` | |
| 236 | | Meetings held | Count deals at or past "Meeting Held" stage | |
| 237 | | No-show rate | (Meetings booked - Meetings held) / Meetings booked | |
| 238 | | Period-over-period change | Compare to comparison period | |
| 239 | | vs. Target | Compare to `target_meetings` if set | |
| 240 | | Weekly run rate | Total / weeks in period | |
| 241 | |
| 242 | **Output:** |
| 243 | |
| 244 | volume: { |
| 245 | deals_created: integer |
| 246 | meetings_booked: integer |
| 247 | meetings_held: integer |
| 248 | no_show_count: integer |
| 249 | no_show_rate: percentage |
| 250 | weekly_run_rate: float |
| 251 | vs_prior_period: { |
| 252 | deals_change: percentage # "+15%" or "-8%" |
| 253 | meetings_change: percentage |
| 254 | } | null |
| 255 | vs_target: { |
| 256 | target: integer |
| 257 | actual: integer |
| 258 | gap: integer # Positive = ahead, negative = behind |
| 259 | } | null |
| 260 | } |
| 261 | |
| 262 | |
| 263 | |
| 264 | |
| 265 | #### Analysis 2: Qualification Breakdown |
| 266 | |
| 267 | **Questions answered:** How many meetings were qualified? Unqualified? What's our qualification rate? |
| 268 | |
| 269 | | Metric | How to Calculate | |
| 270 | |--------|-----------------| |
| 271 | | Qualified deals | Deals at or past `qualified_stage` | |
| 272 | | Unqualified deals | Deals that were closed lost before reaching `qualified_stage`, or deals marked as unqualified | |
| 273 | | Qualification rate | Qualified / (Qualified + Unqualified) | |
| 274 | | Pending qualification | Deals still between "Meeting Held" and `qualified_stage` | |
| 275 | | Disqualification reasons | Group `loss_reason` for deals lost pre-qualification | |
| 276 | | vs. Prior period | Compare qualification rate | |
| 277 | | vs. Target | Compare to `target_qual_rate` if set | |
| 278 | |
| 279 | **Output:** |
| 280 | |
| 281 | qualification: { |
| 282 | qualified_count: integer |
| 283 | unqualified_count: integer |
| 284 | pending_count: integer |
| 285 | qualification_rate: percentage |
| 286 | vs_prior_period: percentage_change | null |
| 287 | vs_target: { target: percentage, actual: percentage } | null |
| 288 | top_disqualification_reasons: [ |
| 289 | { reason: string, count: integer, percentage: percentage } |
| 290 | ] |
| 291 | } |
| 292 | |
| 293 | |
| 294 | |
| 295 | |
| 296 | #### Analysis 3: Source / Channel Attribution |
| 297 | |
| 298 | **Questions answered:** Where are leads coming from? Which sources produce the most qualified meetings? |
| 299 | |
| 300 | | Metric | How to Calculate | |
| 301 | |--------|-----------------| |
| 302 | | Deals by source | Group by `source`, count | |
| 303 | | Meetings by source | Group by `source`, count meetings | |
| 304 | | Qualification rate by source | For each source: qualified / total | |
| 305 | | Best source (volume) | Source with most deals | |
| 306 | | Best source (quality) | Source with highest qualification rate (min 5 deals for statistical relevance) | |
| 307 | | Source with highest conversion to won | Source with best close rate | |
| 308 | | Source trends | Compare to prior period | |
| 309 | |
| 310 | **Output:** |
| 311 | |
| 312 | source_attribution: { |
| 313 | by_source: [ |
| 314 | { |
| 315 | source: string |
| 316 | deals_created: integer |
| 317 | meetings_booked: integer |
| 318 | meetings_qualified: integer |
| 319 | qualification_rate: percentage |
| 320 | deals_won: integer |
| 321 | win_rate: percentage |
| 322 | revenue: number | null |
| 323 | vs_prior_period: percentage_change | null |
| 324 | } |
| 325 | ] |
| 326 | best_volume_source: string |
| 327 | best_quality_source: string |
| 328 | best_conversion_source: string |
| 329 | source_concentration_warning: string | null # Flag if >60% from one source |
| 330 | } |
| 331 | |
| 332 | |
| 333 | |
| 334 | |
| 335 | #### Analysis 4: Stage Distribution & Velocity |
| 336 | |
| 337 | **Questions answered:** Where are deals sitting in the pipeline? How fast are they moving through stages? |
| 338 | |
| 339 | | Metric | How to Calculate | |
| 340 | |--------|-----------------| |
| 341 | | Deal count by stage | Group active deals by current `stage` | |
| 342 | | Revenue by stage | Sum `amount` per stage | |
| 343 | | Average days in each stage | For deals that passed through each stage, average `days_in_current_stage` | |
| 344 | | Stage-to-stage conversion | What % of deals move from one stage to the next | |
| 345 | | Pipeline velocity | (Deals × Win Rate × Avg Deal Size) / Avg Cycle Length | |
| 346 | | Total pipeline value | Sum of `amount` for all active deals | |
| 347 | | Weighted pipeline | Sum of (amount × stage probability) for each deal | |
| 348 | |
| 349 | **Stage probability defaults** (override with actual data if available): |
| 350 | |
| 351 | Lead: 5% |
| 352 | Meeting Booked: 10% |
| 353 | Meeting Held: 20% |
| 354 | Qualified: 40% |
| 355 | Proposal Sent: 60% |
| 356 | Negotiation: 80% |
| 357 | Closed Won: 100% |
| 358 | Closed Lost: 0% |
| 359 | |
| 360 | |
| 361 | **Output:** |
| 362 | |
| 363 | stage_analysis: { |
| 364 | by_stage: [ |
| 365 | { |
| 366 | stage: string |
| 367 | deal_count: integer |
| 368 | revenue: number | null |
| 369 | weighted_revenue: number | null |
| 370 | avg_days_in_stage: float |
| 371 | conversion_to_next_stage: percentage |
| 372 | } |
| 373 | ] |
| 374 | total_pipeline_value: number | null |
| 375 | weighted_pipeline_value: number | null |
| 376 | pipeline_velocity: number | null |
| 377 | avg_cycle_length_days: float |
| 378 | vs_expected_cycle: string # "On pace", "X days slower than expected", etc. |
| 379 | } |
| 380 | |
| 381 | |
| 382 | |
| 383 | |
| 384 | #### Analysis 5: Stuck Deals & At-Risk Pipeline |
| 385 | |
| 386 | **Questions answered:** Are there deals that have been sitting too long? What's at risk of going stale? |
| 387 | |
| 388 | | Metric | How to Calculate | |
| 389 | |--------|-----------------| |
| 390 | | Stuck deals | Deals where `days_in_current_stage` > 2× average for that stage, OR > `expected_cycle_days` total | |
| 391 | | No activity deals | Deals where `last_activity_date` > 14 days ago | |
| 392 | | Aging deals | Deals where `total_age_days` > 1.5× `expected_cycle_days` | |
| 393 | | At-risk revenue | Sum of `amount` for stuck + no activity + aging deals | |
| 394 | | Concentration risk | Any single deal > 30% of total pipeline value | |
| 395 | |
| 396 | **Stuck deal threshold:** A deal is "stuck" if it's been in its current stage for more than 2× the average time deals spend in that stage. If we don't have enough data for stage averages, use these defaults: |
| 397 | |
| 398 | | Stage | Expected Max Days | |
| 399 | |-------|------------------| |
| 400 | | Lead | 3 days | |
| 401 | | Meeting Booked | 7 days | |
| 402 | | Meeting Held | 5 days | |
| 403 | | Qualified | 10 days | |
| 404 | | Proposal Sent | 14 days | |
| 405 | | Negotiation | 14 days | |
| 406 | |
| 407 | **Output:** |
| 408 | |
| 409 | stuck_and_at_risk: { |
| 410 | stuck_deals: [ |
| 411 | { |
| 412 | name: string |
| 413 | company: string |
| 414 | stage: string |
| 415 | days_in_stage: integer |
| 416 | expected_max_days: integer |
| 417 | owner: string | null |
| 418 | amount: number | null |
| 419 | last_activity: string | null |
| 420 | recommended_action: string # "Follow up", "Ask for timeline", "Qualify out" |
| 421 | } |
| 422 | ] |
| 423 | no_activity_deals: [ |
| 424 | { |
| 425 | name: string |
| 426 | company: string |
| 427 | stage: string |
| 428 | days_since_activity: integer |
| 429 | owner: string | null |
| 430 | recommended_action: string |
| 431 | } |
| 432 | ] |
| 433 | at_risk_revenue: number | null |
| 434 | concentration_risks: [ |
| 435 | { deal_name: string, amount: number, percentage_of_pipeline: percentage } |
| 436 | ] | null |
| 437 | } |
| 438 | |
| 439 | |
| 440 | |
| 441 | |
| 442 | #### Analysis 6: Win/Loss Analysis |
| 443 | |
| 444 | **Questions answered:** What's our win rate? Why are we losing deals? |
| 445 | |
| 446 | | Metric | How to Calculate | |
| 447 | |--------|-----------------| |
| 448 | | Win rate | Won / (Won + Lost) for deals closed in period | |
| 449 | | Win rate by source | Group by source | |
| 450 | | Win rate by owner | Group by rep | |
| 451 | | Average deal size (won) | Avg `amount` of won deals | |
| 452 | | Average time to close | Avg days from created to closed won | |
| 453 | | Top loss reasons | Group `loss_reason`, count | |
| 454 | | Loss stage distribution | At which stage are deals most often lost? | |
| 455 | | vs. Prior period | Compare win rate | |
| 456 | | vs. Target | Compare to `target_win_rate` if set | |
| 457 | |
| 458 | **Output:** |
| 459 | |
| 460 | win_loss: { |
| 461 | deals_won: integer |
| 462 | deals_lost: integer |
| 463 | win_rate: percentage |
| 464 | vs_prior_period: percentage_change | null |
| 465 | vs_target: { target: percentage, actual: percentage } | null |
| 466 | avg_deal_size_won: number | null |
| 467 | avg_days_to_close: float |
| 468 | win_rate_by_source: [ { source: string, win_rate: percentage, count: integer } ] |
| 469 | win_rate_by_owner: [ { owner: string, win_rate: percentage, count: integer } ] | null |
| 470 | top_loss_reasons: [ |
| 471 | { reason: string, count: integer, percentage: percentage } |
| 472 | ] |
| 473 | loss_by_stage: [ |
| 474 | { stage: string, lost_count: integer, percentage: percentage } |
| 475 | ] |
| 476 | } |
| 477 | |
| 478 | |
| 479 | |
| 480 | |
| 481 | #### Analysis 7: Forecast & Coverage |
| 482 | |
| 483 | **Questions answered:** Are we going to hit our number? Do we have enough pipeline to cover the target? |
| 484 | |
| 485 | Only run this analysis if `target_pipeline_value` or revenue targets are configured. |
| 486 | |
| 487 | | Metric | How to Calculate | |
| 488 | |--------|-----------------| |
| 489 | | Pipeline coverage ratio | Weighted pipeline / remaining quota | |
| 490 | | Commit forecast | Sum of deals in Negotiation + Proposal stage | |
| 491 | | Best case forecast | Commit + Qualified deals × historical win rate | |
| 492 | | Gap to target | Target - best case forecast | |
| 493 | | Required deals to close gap | Gap / average deal size | |
| 494 | | Required meetings to close gap | Required deals / historical meeting-to-close rate | |
| 495 | |
| 496 | **Output:** |
| 497 | |
| 498 | forecast: { |
| 499 | target: number |
| 500 | commit_forecast: number |
| 501 | best_case_forecast: number |
| 502 | gap_to_target: number |
| 503 | pipeline_coverage_ratio: float # 3x+ is healthy, <2x is risky |
| 504 | deals_needed_to_close_gap: integer |
| 505 | meetings_needed_to_close_gap: integer |
| 506 | coverage_assessment: "Healthy (3x+)" | "Adequate (2-3x)" | "At risk (<2x)" | "Critical (<1x)" |
| 507 | } | null |
| 508 | |
| 509 | |
| 510 | |
| 511 | |
| 512 | ### Output Contract (Full Analysis) |
| 513 | |
| 514 | |
| 515 | analysis: { |
| 516 | period: { type, start_date, end_date } |
| 517 | volume: { ... } |
| 518 | qualification: { ... } |
| 519 | source_attribution: { ... } |
| 520 | stage_analysis: { ... } |
| 521 | stuck_and_at_risk: { ... } |
| 522 | win_loss: { ... } |
| 523 | forecast: { ... } | null |
| 524 | } |
| 525 | |
| 526 | |
| 527 | No human checkpoint after this step — the analysis feeds directly into report generation. |
| 528 | |
| 529 | |
| 530 | |
| 531 | ## Step 3: Generate Report |
| 532 | |
| 533 | **Purpose:** Transform the raw analysis into two report formats: an executive summary and a detailed diagnostic. Pure LLM reasoning. |
| 534 | |
| 535 | ### Input Contract |
| 536 | |
| 537 | |
| 538 | analysis: { ... } # From Step 2 |
| 539 | benchmarks: { ... } | null # From config |
| 540 | |
| 541 | |
| 542 | ### Executive Summary Format |
| 543 | |
| 544 | One page. Numbers and trends. What a founder or sales leader needs to see in 60 seconds. |
| 545 | |
| 546 | |
| 547 | # Pipeline Review — [Period Type]: [Start Date] to [End Date] |
| 548 | |
| 549 | ## Snapshot |
| 550 | | Metric | This Period | Prior Period | Change | |
| 551 | |--------|------------|-------------|--------| |
| 552 | | Meetings booked | X | Y | +/-Z% | |
| 553 | | Meetings held | X | Y | +/-Z% | |
| 554 | | Qualification rate | X% | Y% | +/-Z pts | |
| 555 | | Win rate | X% | Y% | +/-Z pts | |
| 556 | | Pipeline value | $X | $Y | +/-Z% | |
| 557 | | Avg deal size | $X | $Y | +/-Z% | |
| 558 | | Avg days to close | X | Y | +/-Z | |
| 559 | |
| 560 | ## Red Flags |
| 561 | - [Any metric trending down significantly] |
| 562 | - [Stuck deals above threshold] |
| 563 | - [Pipeline coverage below 2x] |
| 564 | - [Single source >60% of pipeline] |
| 565 | - [No-show rate above 20%] |
| 566 | |
| 567 | ## Green Lights |
| 568 | - [Metrics trending up] |
| 569 | - [Sources performing well] |
| 570 | - [Stages moving faster than expected] |
| 571 | |
| 572 | ## Top 3 Actions |
| 573 | 1. [Most impactful thing to do this week] |
| 574 | 2. [Second most impactful] |
| 575 | 3. [Third most impactful] |
| 576 | |
| 577 | |
| 578 | ### Detailed Diagnostic Format |
| 579 | |
| 580 | Full data tables, charts (as markdown tables), and commentary. |
| 581 | |
| 582 | |
| 583 | # Pipeline Diagnostic — [Period] |
| 584 | |
| 585 | ## 1. Volume |
| 586 | [Volume metrics table] |
| 587 | [Commentary: is volume on track? Trending up or down? Meeting goals?] |
| 588 | |
| 589 | ## 2. Qualification |
| 590 | [Qualification breakdown table] |
| 591 | [Disqualification reasons table] |
| 592 | [Commentary: are we meeting with the right people? Common DQ reasons to address?] |
| 593 | |
| 594 | ## 3. Source Effectiveness |
| 595 | [Source attribution table — sorted by qualification rate] |
| 596 | [Commentary: which channels are working? Which are wasting time? |
| 597 | Where should we invest more? Where should we cut?] |
| 598 | |
| 599 | ## 4. Stage Distribution & Velocity |
| 600 | [Stage breakdown table with counts, revenue, avg days, conversion rates] |
| 601 | [Commentary: where is the pipeline fat? Where is it thin? |
| 602 | Is velocity healthy or slowing?] |
| 603 | |
| 604 | ## 5. Stuck Deals |
| 605 | [Stuck deals table with recommended actions] |
| 606 | [No-activity deals table] |
| 607 | [Commentary: total at-risk revenue, common patterns in stuck deals] |
| 608 | |
| 609 | ## 6. Win/Loss Analysis |
| 610 | [Win rate table — overall, by source, by owner] |
| 611 | [Loss reasons table] |
| 612 | [Loss by stage table] |
| 613 | [Commentary: why are we losing? At which stage? Any patterns?] |
| 614 | |
| 615 | ## 7. Forecast & Coverage (if targets set) |
| 616 | [Forecast table] |
| 617 | [Coverage assessment] |
| 618 | [Commentary: will we hit the number? What needs to happen?] |
| 619 | |
| 620 | ## Recommendations |
| 621 | [Numbered list of specific, actionable recommendations based on the data. |
| 622 | Each recommendation should cite the specific data point that drives it.] |
| 623 | |
| 624 | |
| 625 | ### Recommendations Logic |
| 626 | |
| 627 | Generate recommendations based on patterns found in the analysis: |
| 628 | |
| 629 | | Pattern | Recommendation | |
| 630 | |---------|---------------| |
| 631 | | Qualification rate <40% | "Review ICP targeting — we're meeting with too many unqualified prospects. Top DQ reason is [X]. Consider tightening [source/criteria]." | |
| 632 | | No-show rate >20% | "Implement meeting confirmation flow — send reminders 24h and 1h before. Current no-show rate of X% is costing Y meetings/period." | |
| 633 | | One source >60% of pipeline | "Diversify lead sources — [source] drives X% of pipeline. If this channel underperforms, pipeline collapses. Test [alternative channels]." | |
| 634 | | High-quality source with low volume | "Scale [source] — it has a X% qualification rate (best in pipeline) but only Y% of volume. Invest more here." | |
| 635 | | Deals stuck in a specific stage | "Unblock [stage] — X deals averaging Y days (2× normal). Common pattern: [observation]. Recommended: [specific action]." | |
| 636 | | Win rate declining | "Win rate dropped from X% to Y%. Top loss reason shifted to [Z]. Consider: [specific response]." | |
| 637 | | Pipeline coverage <2x | "Pipeline coverage is [X]x against [target]. Need Z more qualified deals to close the gap. At current conversion rates, that requires W meetings." | |
| 638 | | Average cycle lengthening | "Deals are taking X days longer to close vs. prior period. Bottleneck is at [stage]. Consider: [specific action to accelerate]." | |
| 639 | | High loss rate at specific stage | "X% of losses happen at [stage]. This suggests [interpretation]. Consider: [action]." | |
| 640 | |
| 641 | ### Output Contract |
| 642 | |
| 643 | |
| 644 | report: { |
| 645 | executive_summary: string # Markdown formatted |
| 646 | detailed_diagnostic: string # Markdown formatted |
| 647 | recommendations: [ |
| 648 | { |
| 649 | priority: "high" | "medium" | "low" |
| 650 | area: string # "volume", "qualification", "source", "velocity", "stuck", "win_loss", "forecast" |
| 651 | recommendation: string |
| 652 | data_point: string # The specific metric that drove this recommendation |
| 653 | expected_impact: string # What fixing this would do |
| 654 | } |
| 655 | ] |
| 656 | stuck_deal_actions: [ |
| 657 | { |
| 658 | deal_name: string |
| 659 | company: string |
| 660 | action: string |
| 661 | owner: string | null |
| 662 | } |
| 663 | ] |
| 664 | } |
| 665 | |
| 666 | |
| 667 | ### Human Checkpoint |
| 668 | |
| 669 | Present the executive summary first, then offer the detailed diagnostic: |
| 670 | |
| 671 | |
| 672 | [Executive Summary rendered] |
| 673 | |
| 674 | |
| 675 | |
| 676 | Full detailed diagnostic is also available. |
| 677 | |
| 678 | Actions from this review: |
| 679 | 1. [High priority recommendation] |
| 680 | 2. [High priority recommendation] |
| 681 | 3. [Medium priority recommendation] |
| 682 | |
| 683 | Stuck deals requiring immediate attention: |
| 684 | | Deal | Company | Stage | Days Stuck | Action | |
| 685 | |------|---------|-------|------------|--------| |
| 686 | | ... | ... | ... | ... | ... | |
| 687 | |
| 688 | Want to see the full diagnostic? Or take action on any of these recommendations? |
| 689 | |
| 690 | |
| 691 | |
| 692 | |
| 693 | ## Step 4: Export & Share (Optional) |
| 694 | |
| 695 | **Purpose:** Save the report and optionally push it to the user's preferred location. |
| 696 | |
| 697 | ### Process |
| 698 | |
| 699 | Based on user preference: |
| 700 | |
| 701 | | Destination | How | |
| 702 | |-------------|-----| |
| 703 | | **Markdown file** | Save to the current working directory | |
| 704 | | **Google Sheets** | Export data tables to a sheet (metrics, deal list, source breakdown) | |
| 705 | | **Notion** | Push to a Notion database page via Notion MCP | |
| 706 | | **Slack** | Send executive summary to a channel | |
| 707 | | **Email** | Send via AgentMail API (agentmail.dev) or other email API | |
| 708 | | **stdout** | Just display it (default) | |
| 709 | |
| 710 | |
| 711 | |
| 712 | ## Execution Summary |
| 713 | |
| 714 | | Step | Tool Dependency | Human Checkpoint | Typical Time | |
| 715 | |------|----------------|-----------------|--------------| |
| 716 | | 0. Config | None | First run only | 5 min (once) | |
| 717 | | 1. Pull Data | Configurable (CRM API, CSV, Supabase, etc.) | Verify data looks correct | 1-2 min | |
| 718 | | 2. Analyze | None (computation + LLM reasoning) | None — feeds directly to report | Automatic | |
| 719 | | 3. Generate Report | None (LLM reasoning) | Review executive summary, drill into details | 5-10 min | |
| 720 | | 4. Export | Configurable (file, Sheets, Notion, etc.) | Optional | 1 min | |
| 721 | |
| 722 | **Total human review time: ~10-15 minutes** for a full pipeline review that would normally take 30-60 minutes of manual CRM digging. |
| 723 | |
| 724 | |
| 725 | |
| 726 | ## Adapting to Data Availability |
| 727 | |
| 728 | Not every CRM has every field. The analysis degrades gracefully: |
| 729 | |
| 730 | | Missing Field | What Gets Skipped | Analysis Still Works? | |
| 731 | |--------------|-------------------|----------------------| |
| 732 | | `amount` | Revenue metrics, weighted pipeline, forecast | Yes — volume and stage analysis still run | |
| 733 | | `source` | Source attribution (Analysis 3) | Yes — everything else still runs | |
| 734 | | `loss_reason` | Loss reason breakdown | Yes — win/loss rate still calculates | |
| 735 | | `owner` | Per-rep analysis | Yes — aggregate metrics still run | |
| 736 | | `last_activity_date` | No-activity deal detection | Partially — stuck deals still detected via stage duration | |
| 737 | | `close_date` | Velocity, avg days to close | Partially — stage distribution still works | |
| 738 | | Comparison period data | Period-over-period trends | Yes — single period analysis still produces full report | |
| 739 | |
| 740 | **Minimum viable data for a useful report:** Deal name + Stage + Created date. Everything else enriches but isn't required. |
| 741 | |
| 742 | |
| 743 | |
| 744 | ## Cadence Guide |
| 745 | |
| 746 | | Review Type | Period | Audience | Focus | |
| 747 | |-------------|--------|----------|-------| |
| 748 | | **Weekly standup** | Last 7 days | Sales team | Volume, stuck deals, this week's priorities | |
| 749 | | **Fortnightly review** | Last 14 days | Sales leader | Qualification, source effectiveness, trends | |
| 750 | | **Monthly review** | Last 30 days | Founder / VP Sales | Full diagnostic, win/loss, forecast | |
| 751 | | **Quarterly business review** | Last 90 days | Leadership / Board | Trends, unit economics, strategic recommendations | |
| 752 | |
| 753 | The report depth automatically scales with the period length. A weekly review emphasizes volume and stuck deals. A quarterly review emphasizes trends, conversion rates, and strategic patterns. |
| 754 | |
| 755 | |
| 756 | |
| 757 | ## Tips |
| 758 | |
| 759 | **Run this at a consistent cadence.** The value compounds — trends only become visible when you have multiple data points. A monthly review is 10x more useful when you can compare to the last 3 months. |
| 760 | **Don't skip the stuck deals section.** This is where the immediate ROI lives. Every stuck deal surfaced and unblocked is revenue accelerated. |
| 761 | **Source attribution is the highest-leverage insight.** Knowing that LinkedIn generates 3x the qualification rate of cold email means you should shift budget and effort. Most teams never run this analysis. |
| 762 | **Watch for vanity metrics.** "We booked 40 meetings" means nothing if qualification rate is 15%. Volume without quality is a waste of everyone's time. |
| 763 | **The no-show rate is a hidden leak.** Most teams track meetings booked but not meetings held. A 25% no-show rate means 1 in 4 meetings is wasted effort. Fix with confirmation sequences. |
| 764 | **Pipeline coverage below 2x is a red flag.** If you need $100K this quarter and your weighted pipeline is $150K, you probably won't make it. Healthy is 3x+. |
| 765 | **Loss reason data is only useful if reps actually fill it in.** If 80% of losses say "Other" or are blank, the loss analysis is meaningless. Fix data hygiene first. |
| 766 |
Details
- Version
- 1.0.0
- Updated
- Sep 21, 2026
- License
- MIT
- Stars on the repo
- ★ 1,220
- Checked
- Source
- gooseworks-ai/goose-skills ↗
- Creator
- gooseworks-ai · 205 listings
Similar skills
See all → AgentNEXUS Quick-Start Guide
 msitarzewski/agency-agents · by msitarzewski> Get from zero to orchestrated multi-agent pipeline in 5 minutes.★ 154k GitHub stars
 SkillRaw Footage Cleanup
 hassancs91/claude-youtube-editor · by hassancs91Step 1 of the AI Video Editor pipeline — turn raw talking-head footage into a clean master cut. Use when the user wants to "clean cut", "cut the raw footage", "remove filler / dead air / bad takes", "tighten the pacing", produce cuts.json, run the cut editor, or render a cleaned preview/master for a video-N project in this repo. Covers audio extraction, AssemblyAI transcription, authoring cuts.json (keeps/cuts/fluff categorized), the cut policy (content-aggressive, pause-natural ~0.5s), QA + review docs, the local cut-editor UI, tight/natural previews, the final 4K60 render, and producing edited-transcript.json as the handoff to /make-tsx. Not for building TSX overlays (that is /make-tsx) or the raw TSX authoring rules (that is vidtsx-2d-generator).★ 330 GitHub stars
 SkillVocaloid Music Video Builder
 EGSECDA/vocaloid-style-mv-pipeline · by EGSECDAMake an original animated music video (MV / PV) for a song from its audio file plus lyrics, in the Vocaloid / J-pop lyric-video tradition: 手書き/tegaki (V家手书, 手描きMV, ボカロPV), 文字PV and kinetic typography (リリックモーション, リリックビデオ, 歌詞動画, 歌词视频, 动态歌词), anime-illustration MVs with an original character — for any mood, from dark ballads to bright upbeat summer pop. Renders to MP4 with a deterministic Canvas2D/WebGL2 engine in a headless browser: JIZURA lyric motion, AI-generated art, optional Blender toon 3D, beat-locked editing, 9:16 vertical/Shorts version. Use it whenever the user wants a music video, MV, PV, lyric video or beat-synced animation for a song, e.g. make an MV for my song", "turn this track into a lyric video", "给这首歌做个MV/PV", "做个V家手书", "この曲のMVを作って", ボカロPV作って", "縦型ショートも" — even if they only give a .wav/.mp3 and say "make a cool video for it". Not for editing existing footage or clip compilations.★ 169 GitHub stars
 SkillConstruction Project Manager
 hewi333/Mom-n-Pop-Skills · by hewi333Construction company AI agent — orchestrates email (Google Workspace), project management (JobTread Pave API), and file routing for a construction business. Handles email triage, attachment routing to JobTread, project status, task management, and daily briefings via Telegram. Reference implementation for a construction/trades business with an existing email→Drive→PM pipeline.★ 122 GitHub stars
 SkillLightweight SQLite CRMhewi333/Mom-n-Pop-Skills · by hewi333Use when tracking customer interactions, managing leads, or building a lightweight CRM for small businesses without dedicated CRM software. Stores contacts, leads, activities, estimates, and communications in local SQLite.★ 122 GitHub stars
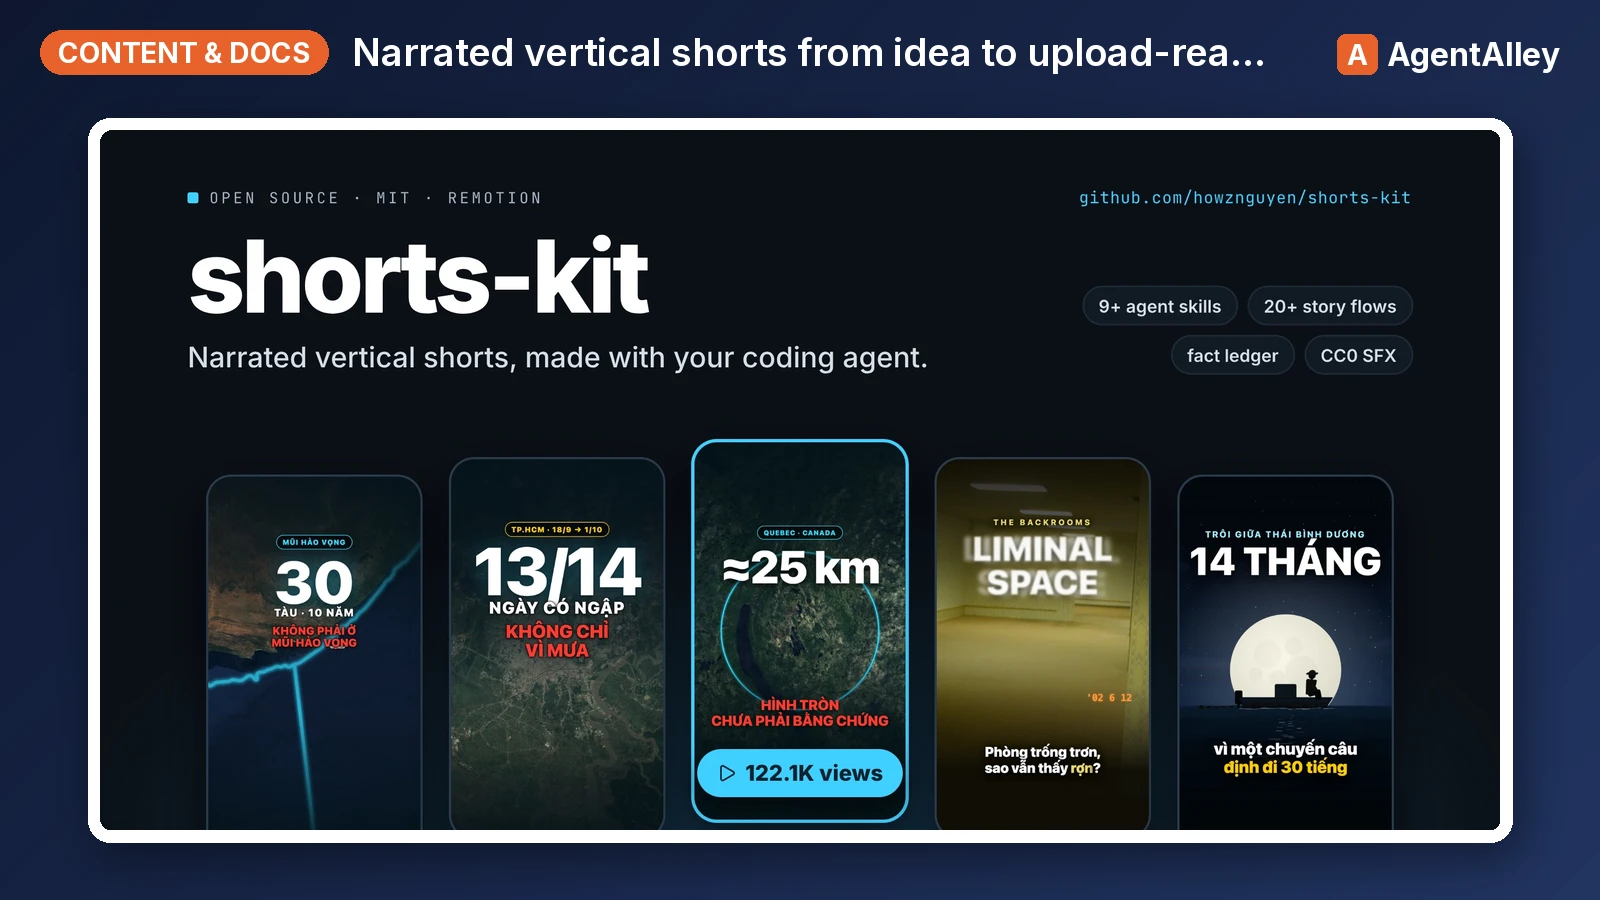 SkillShort Video Pipeline
 howznguyen/shorts-kit · by howznguyenOrchestrates one narrated vertical short (TikTok, YouTube Shorts, Reels) from idea to upload-ready hand-off files, in the fixed order idea, facts, flow and visual choice, brief, narration, TTS, lint, scenes, still review, render, cover, normalize, encode, hand-off. Use when the user says "make a video about X", "start a new short", "take this idea to a finished video", "what's the next step", "where was I on this video", or asks how the whole pipeline fits together. Also when the user gives a video or audio file (or a folder of clips) to edit: "edit this video", "dựng video này", a .mov/.mp4 path. Points at the skill and the SOUL section that governs each step.★ 69 GitHub stars
More from gooseworks-ai
 SkillAd Angle Miner
 gooseworks-ai/goose-skills · by gooseworks-aiMine the highest-converting ad angles from customer reviews, Reddit complaints, support tickets, and competitor ads. Extracts actual pain language, competitor weaknesses, and outcome phrases that real buyers use. Outputs a ranked angle bank with proof quotes and recommended ad formats per angle.★ 1.2k GitHub stars
 SkillAd Campaign Analyzergooseworks-ai/goose-skills · by gooseworks-aiAnalyze ad campaign performance data (Google, Meta, LinkedIn) to identify what's working, what's wasting budget, and specific cut/scale/test recommendations. Runs statistical analysis, funnel diagnostics, and multi-channel budget reallocation with specific dollar-amount shift recommendations and scenario modeling.★ 1.2k GitHub stars
 SkillLead Quality Analyzergooseworks-ai/goose-skills · by gooseworks-aiFor paid lead-gen and participant-recruitment ads, replaces vanity CPA with true CAC per qualified lead by joining ad-platform data with downstream funnel events, surfaces tracking gaps, and classifies every creative into Scale / Keep / Investigate / Cut.★ 1.2k GitHub stars
 SkillMessage Match Auditorgooseworks-ai/goose-skills · by gooseworks-aiAnalyze the message match between your ads and landing pages. Checks if the promise in the ad copy carries through to the landing page headline, body, and CTA. Flags disconnects that kill conversion rates. Works with Google, Meta, and LinkedIn ads.★ 1.2k GitHub stars
 SkillAI Search Visibilitygooseworks-ai/goose-skills · by gooseworks-aiCheck and improve your brand's visibility across AI search engines (ChatGPT, Perplexity, Gemini, Grok, Claude, DeepSeek). Set up tracking, run visibility analyses, audit your website for AI readability, and get actionable recommendations. Uses the npx goose-aeo@latest CLI.★ 1.2k GitHub stars
 SkillAmazon Product Searchgooseworks-ai/goose-skills · by gooseworks-aiSearch Amazon products - find items, compare prices, read reviews★ 1.2k GitHub stars